Figure 1
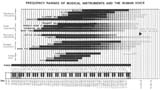
Figure 2
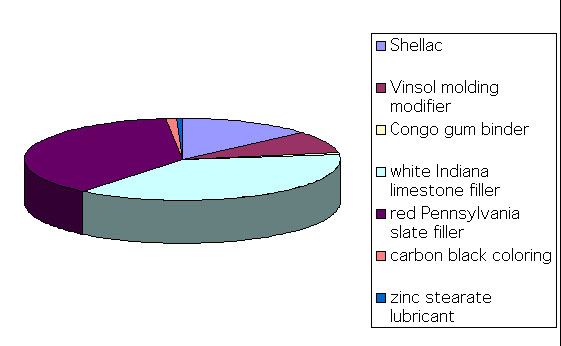
Figure 3
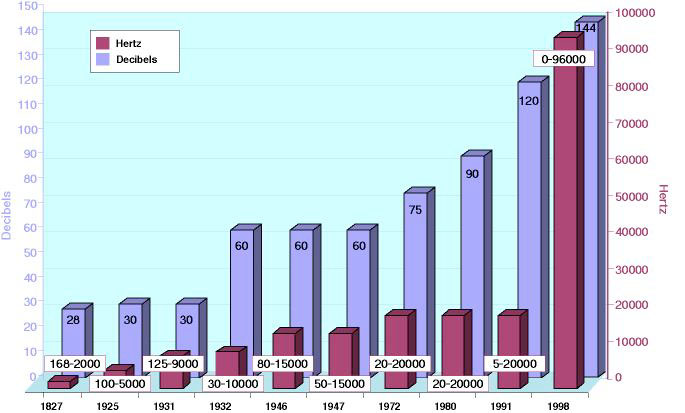
Figure 4
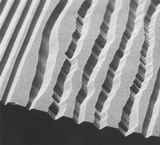
Figure 5
Figure 1 |
Figure 2 |
Figure 3 |
Figure 4 |
Figure 5 |
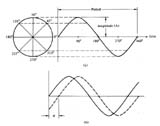
Beginning in the High Fidelity era after World War II, the terms "Hertz" (Hz) and "kilohertz" (kHz, or one thousand Hz) replaced the older term "cps" in recognition of the pioneer physicist Heinrich Hertz who generated and measured electromagnetic waves in 1886. Low sounds have a long frequency wave and high sounds a shorter wave. The bass tuba can produce a "pitch" as low as 50 Hz and a piccolo as high as 4500 Hz, the range of the highest piano key. The human ear can hear frequencies from 20 to 20,000 Hz, with most intelligible speech falling within the relatively narrow range of 500 to 2500 Hz. (Figure 2)
The "amplitude" of the sound wave determines its strength, or loudness, and is measured in "decibels," a term adopted in 1928 meaning one-tenth of a Bel (from the name of Alexander Graham Bell), a logarithm of the ratio of the difference in loudness of two sounds. The decibel is not a fixed measurement like the Hertz. It is relative to the two sounds, and measures the incredible ability of the human ear to hear a million-to-one range of sounds. If total silence is measured as 0 dB, then the drop of a pin would be about 10 dB, below the human threshold of hearing but producing measurable sound waves. The relative loudness of sounds doubles every 6-10 dB up to and beyond the pain threshold of 130 dB that is one million times "louder" than the drop of a pin. To the human ear, the Victrola phonograph of 1906 was about 55 dB, no louder than normal conversation. (Figure 4)
This wide range of hearing is limited by the presence of "noise" that can overwhelm the sound signal. The scratches on a record and the hiss of a magnetic tape are examples of noise caused by unwanted deformities or impurities in the recording material. The ratio of the signal strength to this background noise is called the "signal-to-noise ratio" and is another way to measure dynamic range. The shellac discs of the acoustic era before 1925 had a signal-to-noise ratio of only 30 dB, due to a weak analog signal and to the strong noise caused by abrasive fillers in the shellac compound. These fillers, such as limestone and slate, helped grooves survive the wear caused by steel needles tracking at 6 ounces. (Figure 3) The needles wore out before the grooves did, and were often replaced after one or two plays. The signal itself was weak because the early acoustic phonographs had no volume controls, and could only reproduce the strength of the sound wave cut into the groove of the disc. The tapered tone-arm and horn directed sound waves in one direction with few reflections, but did not increase amplitude.
The new amplifiers, microphones and speakers of the electrical era after 1925 made it possible to "gain" signal strength and sound volume by increasing the amplitude of sound waves electrically. In 1931 Leopold Stokowski with his Philadelphia Orchestra used the vertical-cut recorder equipped with a new moving coil pickup with sapphire stylus developed at Bell Labs by Arthur C. Keller to improve the frequency range of cellulose acetate discs pressed from gold-sputtered wax masters to 30-10,000 Hz and the volume to 60 db for a performance of the "Roman Carnival" by Berlioz made on Dec. 1, 1931. When Stokowski later heard the record at Bell Labs in New York City, he said it was the finest recording he had ever heard.
With multiple channels of sound reproduced on motion picture film for Disney's "Fantasia" and the Carnegie Hall concert of 1940, audiences were amazed at "the loudest sounds ever heard." The polyvinyl chloride plastic used to make the "vinyl" LP records in the high fidelity era after World War II did not require abrasive fillers and therefore produced less noise, resulting in a signal-to-noise ratio of 60 dB. (Figure 5) Sound quality improved in the 1960s with lightweight stylus tone-arms, Dolby noise reduction circuits, three-way speakers mounted in bass reflex enclosures. Despite these improvements, the bottleneck of analog sound reproduction remained the physical surface carrier. No groove could be cut small enough to reproduce a 20 mHz frequency tone, and no magnetic tape could rid itself of hiss.
Surface noise disappeared in the digital era with digital "0" and "1" codes independent of any surface material. Sound quality was now determined by "sampling" and "bandwidth." To develop the revolutionary compact disc in 1980, engineers used a computer to measure a sound wave at 44,100 locations on each cycle. Each of these "sampled" locations was defined by a digital "word" 16 bits long, using 65,536 different combinations of "0" and "1" codes to measure the frequency of the sound. Each of these bit codes was stored as a pit in a thin layer of a polycarbonate disc. A laser beam responded to the different sizes of these pits and a computer chip in the CD player reassembled the sound wave from the 16-bit coded samples. Without noise or distortion, the resulting sounds were remarkbly clear within a dynamic range of 96 dB. More powerful computer chips in SDDS movie projectors and DVD audio players of the 1990s created more "bandwidth," or rate of data flow, and therefore clearer and more accurate sounds. The DVD of 1998 sent 24-bit samples at a rate of 9600 kbps, equivalent to a 144 dB dynamic range.
| Year | db | Hz | device | low/high Hz |
| 1897 | 28 | 1832 | shellac disc | 168-2000 |
| 1925 | 30 | 4900 | Orthophonic disc | 100-5000 |
| 1931 | 30 | 8875 | Optical Film | 125-9000 |
| 1931 | 60 | 9970 | cellulose disc | 30-10000 |
| 1946 | 60 | 14920 | Decca FFRR disc | 80-15000 |
| 1947 | 60 | 14950 | Ampex 200 tape | 50-15000 |
| 1972 | 75 | 19980 | Laserdisc | 20-20000 |
| 1980 | 90 | 19980 | Compact Disc | 20-20000 |
| 1991 | 120 | 19995 | Dolby AC-3 | 5-20000 |
| 1998 | 144 | 96000 | DVD-Audio | 0-96000 |
| © 2002 by Steven E. Schoenherr. All rights reserved. |